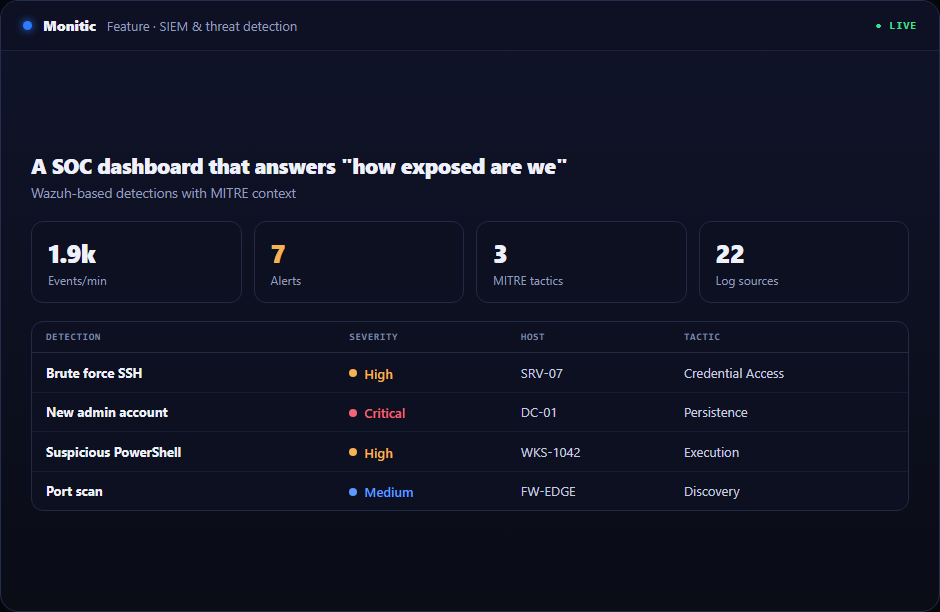
A SOC dashboard that answers "how exposed are we"
Ask most IT organizations for their current security posture and you get a meeting: someone checks the SIEM, someone checks the vulnerability scanner, someone checks the compliance tool, and the answer arrives a day later, already stale. Monitic's SOC dashboard collapses that meeting into a screen. Security posture, active alerts, and vulnerabilities aggregate across the entire fleet — every company, every endpoint — in one view, fed by the same agent and analytics that power the rest of the platform. The question "how exposed are we right now" gets a current answer, on demand.
Posture, alerts, and vulnerabilities — one aggregation
The dashboard pulls together the three signals that define exposure. Posture: how hardened the fleet is, from security configuration assessment and compliance data. Alerts: what is actively happening, from Wazuh-integrated detection — file integrity changes, MITRE ATT&CK-mapped findings, and the rest of the curated stream. Vulnerabilities: what could happen, from CVE data across installed software.
Seen separately, each signal misleads. A clean alert feed means little on a fleet full of unpatched CVEs; a strong posture score means little during an active detection. Seen together, they triangulate — which is what a SOC dashboard is for.
Fleet-wide scope, per-endpoint depth
Aggregation only helps if you can descend from it. From the fleet-level view, drill into a company, then an endpoint, then a specific finding — and because the dashboard lives on the management platform, the endpoint you land on is fully described: hardware, software inventory, patch state, logged-in user, management history. An analyst in a standalone SIEM tabs between consoles to build that picture; here it is the same record.
For MSPs and multi-entity organizations, the company-level rollup turns the dashboard into a client-by-client security report that is always current — the view a virtual CISO conversation starts from.
The dashboard that acts
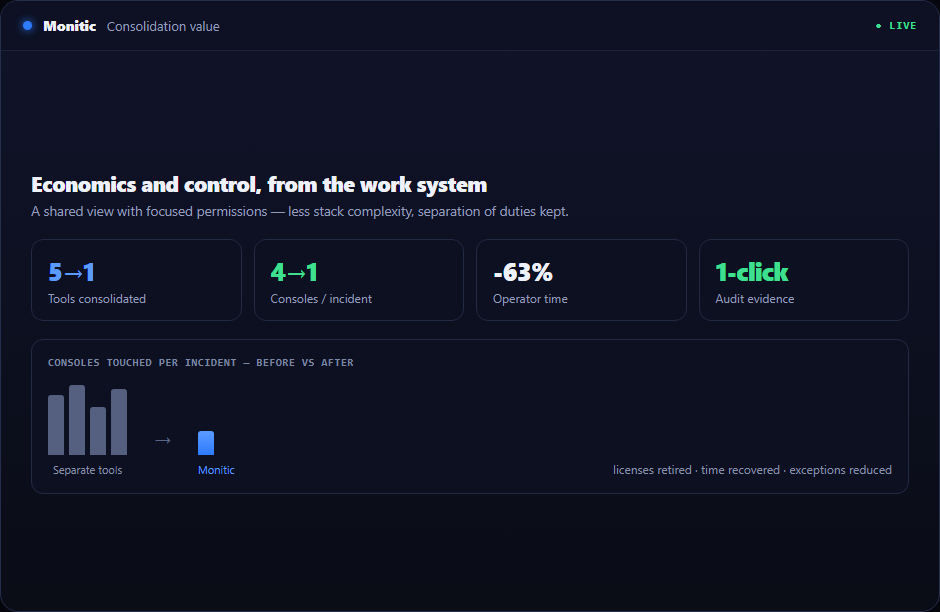
A SOC dashboard bolted onto a detection-only stack ends every workflow the same way: open a ticket somewhere else. Monitic's ends it differently. Any finding on the board sits one click from response on the same platform — deploy the patch that closes a surfaced CVE, dispatch a script to the alerting endpoint, or hand the finding to the AI assistant with its full context. The dashboard is not a window onto the problem; it is a control surface over it.
Raw events stay in the security backend for forensic depth. The dashboard carries the curated layer — findings worth attention, with the means to close them.
Works with
- Log collection — the telemetry stream behind the alert feed
- MITRE ATT&CK mapping — technique labels on every mapped finding
- File integrity monitoring — integrity events in the posture picture
- Vulnerability management — the CVE data feeding the vulnerability pane
Frequently asked questions
What does the SOC dashboard show?
Security posture, active alerts, and vulnerabilities, aggregated across every managed company and endpoint — with drill-down from fleet level to the individual finding on the individual machine.
Do I need a separate SOC platform to use it?
No. The dashboard is part of Monitic's SIEM & threat detection module, fed by the platform agent and Wazuh-integrated analytics. There is no additional product to license or integrate.
Can I respond to findings from the dashboard?
Yes — that is the point. Findings route to remediation on the same platform: patch deployment, script execution, or an AI-assisted fix with full context attached.
Which tier includes the SOC dashboard?
The Enterprise tier, which includes the full SIEM & threat detection module — see pricing for what each tier carries.
See Monitic on your own fleet
Full-featured 14-day trial · no credit card · your real fleet in the console on day one.