Endpoint log collection without a second agent
Every SIEM project stalls at the same place: getting the logs. Standalone platforms need their own collector deployed to every machine, a forwarder architecture to maintain, and a rollout project before the first event arrives — and the machines that miss the rollout are exactly the ones nobody is watching. Monitic removes the project entirely. The agent already managing each endpoint is the collector: it feeds logs and security events into Wazuh-integrated security analytics from the day the device is enrolled. Endpoint log collection stops being an infrastructure program and becomes a property of being managed.
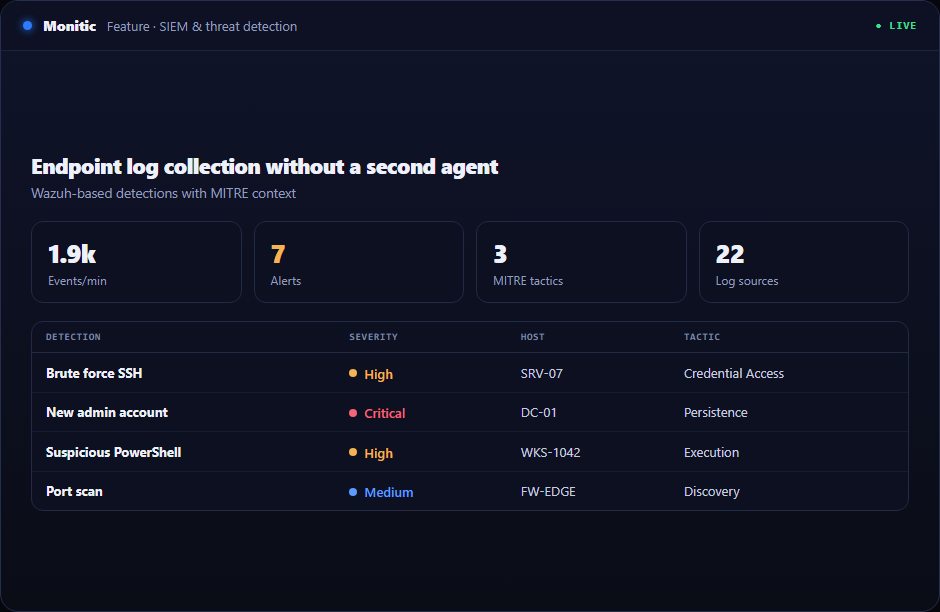
One agent for management and telemetry
The Monitic agent handles inventory, patching, monitoring, and remote access — and security telemetry rides the same channel. That single fact eliminates the failure modes that plague dedicated collectors: version drift between the management and security agents, endpoints covered by one but not the other, and two deployment pipelines to keep in sync. Coverage tracks enrollment automatically. When a new laptop joins the fleet, it starts contributing security events the same day, with no security engineer in the loop.
For a CISO, the audit question "which endpoints are we actually collecting from" gets an unusual answer: all of the managed ones, verifiably, because collection and management are the same footprint.
Analytics in the backend, findings in the console
Collected events flow into the Wazuh-integrated security backend, where the analytical heavy lifting happens — correlation, rule evaluation, detection. The raw event stream stays there. What surfaces in the Monitic console is the curated layer: findings worth an operator's attention, each carrying device context, and each mapped to a MITRE ATT&CK technique where applicable.
This split matters operationally. Teams drowning in raw SIEM events don't lack data — they lack signal. Monitic's console shows the finding, the machine, and the action; the forensic depth remains available in the security backend when an investigation needs it.
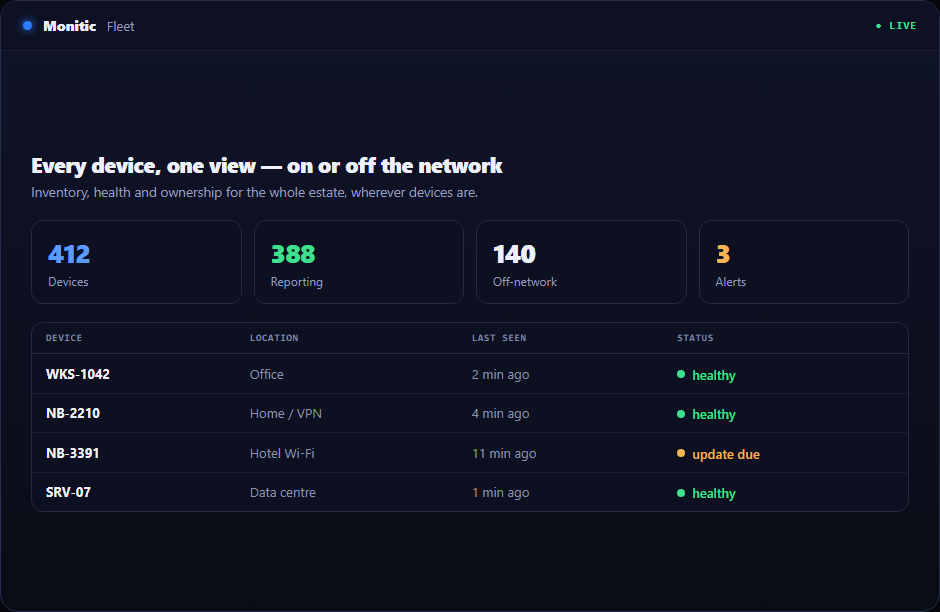
From collected event to closed finding
Because collection lives on the management platform, so does the response. A finding raised from endpoint telemetry sits one click from action: deploy the patch that closes the exploited gap, dispatch a script to the affected machine, or hand the case to the AI assistant with the finding's full context. The SOC dashboard rolls collected findings up into fleet-level posture, so leadership sees the same data the analyst works from.
That end-to-end path — collect, detect, act — is what a collection pipeline into a standalone SIEM never delivers, because the SIEM can see but cannot touch the endpoint.
Works with
- File integrity monitoring — change alerts on critical files and registry entries, from the same telemetry
- MITRE ATT&CK mapping — collected events classified into adversary techniques
- SOC dashboard — collected findings aggregated into fleet posture
- Security compliance — harden the configurations your logs keep flagging
Frequently asked questions
Do I need to install a separate log collector?
No. The Monitic agent already deployed for endpoint management collects logs and security events. There is no second agent, forwarder, or shipping pipeline to build and maintain.
Where do the raw events live?
In the Wazuh-integrated security backend. Monitic deliberately keeps the raw stream out of the management console and surfaces curated findings instead — signal for the operator, depth in the backend for investigations.
How quickly does a new endpoint start reporting?
As soon as it is enrolled. Collection is part of being managed, so security coverage grows with the fleet without a separate onboarding step.
Is this included in every plan?
SIEM & threat detection, including log collection, ships in the Enterprise tier — see pricing for tier details.
See Monitic on your own fleet
Full-featured 14-day trial · no credit card · your real fleet in the console on day one.