SNMP monitoring built into your endpoint platform
Your switches, UPS units, storage arrays, and printers will never run an agent — but they fail, overheat, and saturate links just the same. Monitic's SNMP monitoring puts every SNMP-capable device on the same console as your endpoints, so the infrastructure your fleet depends on is monitored by the platform that already manages the fleet. No standalone SNMP monitoring software, no second pane of glass, no separate invoice.
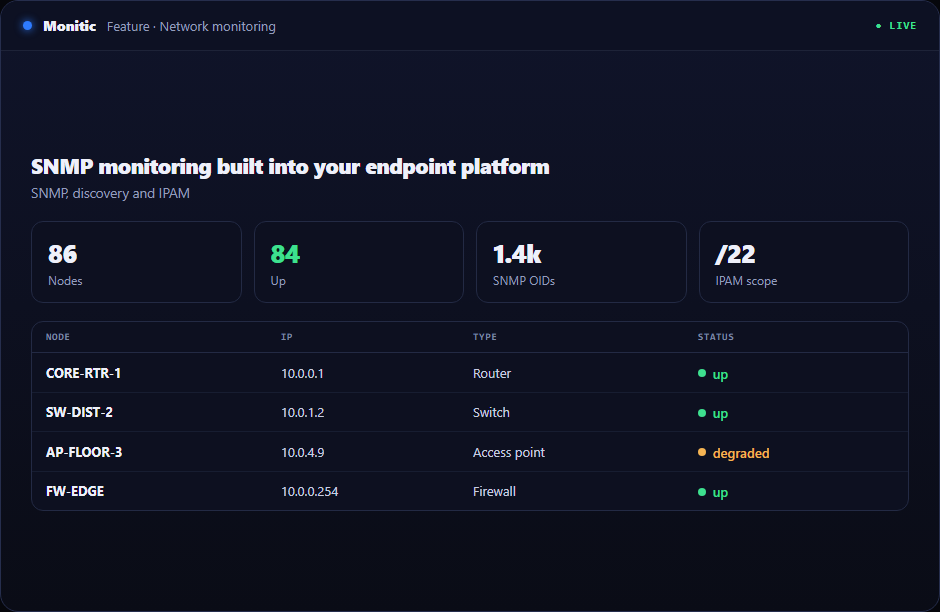
Full protocol coverage: SNMP v1, v2c, and v3
Monitic speaks every SNMP version you will meet in a real estate — the legacy v1 device in the wiring closet, the v2c defaults most vendors ship, and authenticated, encrypted v3 for environments where credentials on the wire are not acceptable.
- SNMP v1 and v2c with community strings for broad device coverage
- SNMP v3 with authentication and privacy for security-sensitive networks
- Mixed fleets supported side by side — configure the right version per device
That last point matters at the executive level: teams often keep an aging network monitor alive purely because it still polls the old gear. Monitic covers old and new in one place, which is one fewer legacy tool on the renewal list.
Live OID streaming per device
Static polling intervals are fine for trend lines and useless for diagnosis. When an interface is flapping or a PSU is failing, you need to watch the value move now. Monitic streams OID values live, per device — open the device, pick the OIDs, and watch them update in real time while you work the problem.
- Stream any OID live during an active incident
- Per-device streams, so diagnosis stays scoped to the device in question
- Combine live values with alert history for cause-and-effect analysis
A sensor model that fits each device
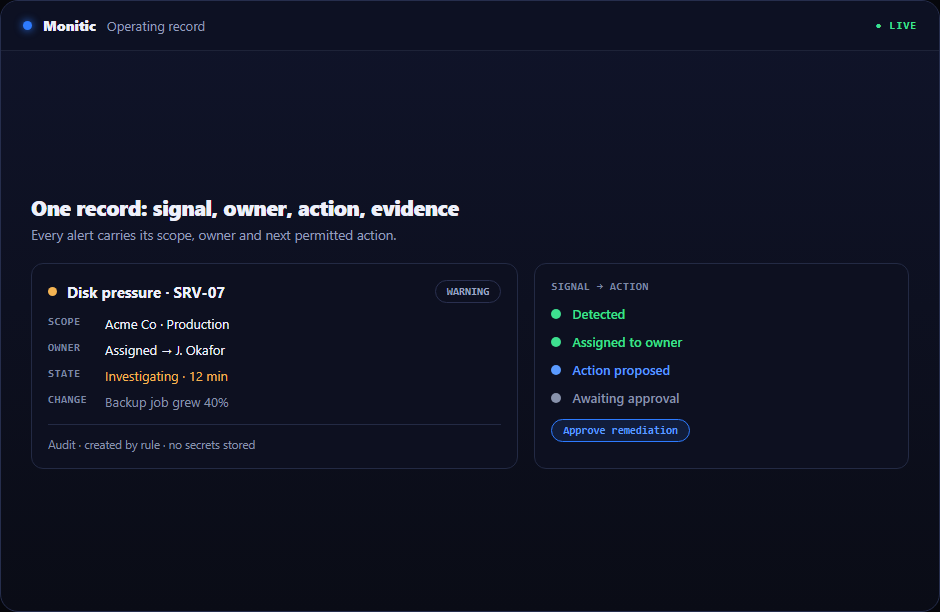
A core switch and a rack UPS do not deserve the same monitoring template. Monitic uses a per-device sensor model: define the sensors that matter for each device — interface throughput, CPU, temperature, PSU state, storage — and set thresholds that trigger alerts in the same alerting pipeline as your endpoints.
- Per-device sensors instead of one-size-fits-all templates
- Threshold alerting routed through the same console as endpoint alerts
- Sensor status rolls up into fleet-wide dashboards and reports
Because SNMP monitoring shares the platform's data model, a failing switch and the endpoints behind it appear as one story, not two disconnected alerts in two tools. When the root cause is on the endpoint side, endpoint management is already on the same screen.
Works with
SNMP monitoring is one part of the network monitoring module. Pair it with network discovery to find the SNMP devices you did not know you had, and with Prometheus exporter monitoring for infrastructure that exposes metrics instead of OIDs.
Frequently asked questions
Does Monitic support SNMPv3 with authentication and encryption?
Yes. v3 profiles with authentication and privacy are supported alongside v1 and v2c, so you can enforce encrypted polling where policy requires it without dropping coverage for older devices.
Can I watch an OID value in real time?
Yes. Live OID streaming is per device: open any monitored device and stream the OIDs you care about while diagnosing an incident, instead of waiting for the next polling cycle.
What kinds of devices can Monitic monitor over SNMP?
Anything that exposes SNMP — switches, routers, firewalls, UPS units, printers, storage arrays, and access points. If it answers on v1, v2c, or v3, it can carry sensors and alerts in Monitic.
See Monitic on your own fleet
Full-featured 14-day trial · no credit card · your real fleet in the console on day one.