Bring exporter metrics into the operational console
Exporters expose rich service and infrastructure metrics, but value is lost when every team must assemble its own scrape, dashboard, and alert stack. Monitic makes exporter monitoring a managed fleet capability.
When prometheus exporter monitoring lives in a separate console, every investigation begins with context assembly. Monitic starts from the opposite assumption: asset identity, tenant scope, permission, history, and response should already be connected before work begins.
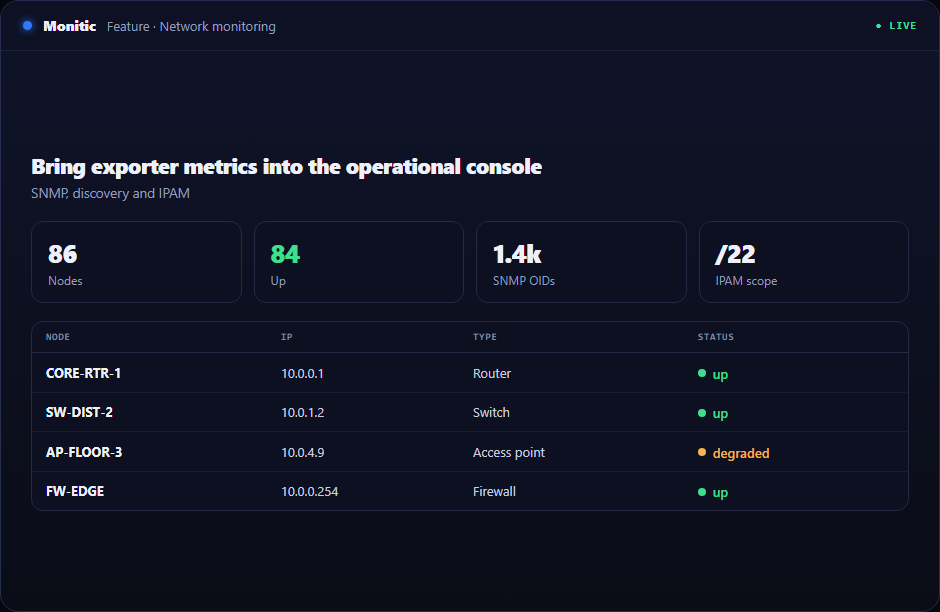
Why this workflow matters
Fragmentation turns simple work into coordination. An operator discovers a condition in one system, looks up ownership in another, requests access to a third, and records the result somewhere else. Prometheus Exporter Monitoring should remove operational delay rather than add a new place where context can be lost.
The platform record acts as the join point. From prometheus exporter monitoring, an operator can reach related device state, alerts, requests, dependencies, and previous work while retaining tenant scope. Decisions begin with current evidence instead of copied identifiers.
What prometheus exporter monitoring looks like in Monitic
Scrape Prometheus-compatible exporters through managed endpoints. Fleet and company views lead into one affected record, allowing teams to separate a broad pattern from an isolated exception before committing effort.
Build dashboards from collected metrics and reusable monitor definitions. The platform preserves the path that led to the decision, making peer review and escalation more useful than a screenshot with no surrounding history.
Apply anomaly detection where fixed thresholds miss unusual behavior. The system records enough operational metadata to reconstruct who did what and where without leaking credentials or relying on request-body archives.
Evaluation checkpoints for prometheus exporter monitoring
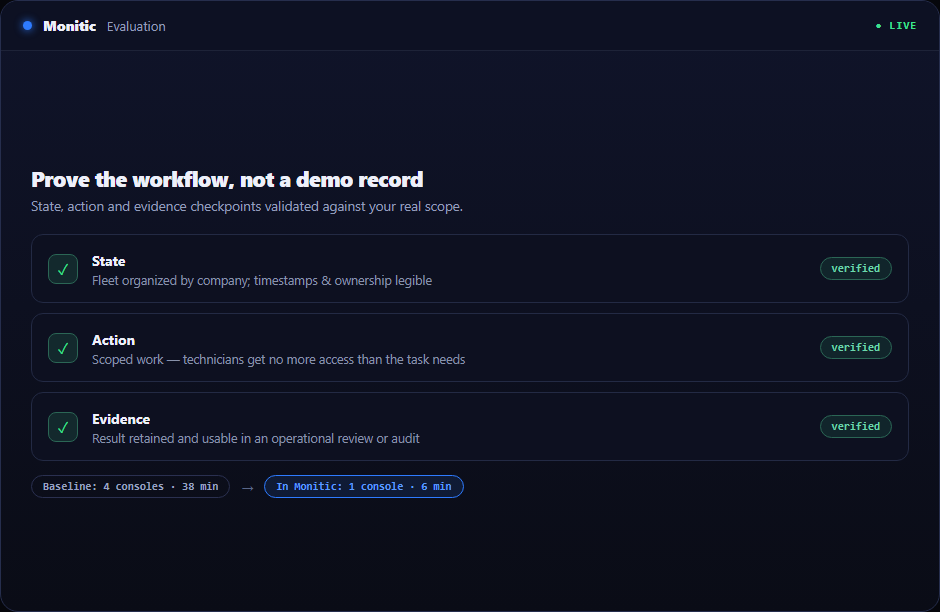
A useful evaluation should prove the workflow against real scope rather than a polished demo record. Use the following checkpoints when validating prometheus exporter monitoring:
- State: Verify that the platform can scrape Prometheus-compatible exporters through managed endpoints and that timestamps, company ownership, and exceptions are understandable to an operator who did not configure the feature.
- Action: Confirm that authorized technicians can build dashboards from collected metrics and reusable monitor definitions without receiving broader access than the task requires.
- Evidence: Check that Monitic can apply anomaly detection where fixed thresholds miss unusual behavior and that the result is useful in an operational review, customer conversation, or audit.
Record the baseline time, number of consoles touched, and evidence available before Monitic. Repeat the same scenario in the trial. The comparison should show whether prometheus exporter monitoring reduces handoffs as well as completing the technical task.
From evidence to verified action
- Start at the operating record. Avoid manually retyping identifiers from another console.
- Correlate. Bring together technical state, service impact, and recent work.
- Execute deliberately. Choose human, automation, or AI-assisted action within scope.
- Verify visibly. Let operators and stakeholders see whether the expected state was restored.
This creates a complete loop instead of an alert-to-spreadsheet handoff.
Business value beyond the feature
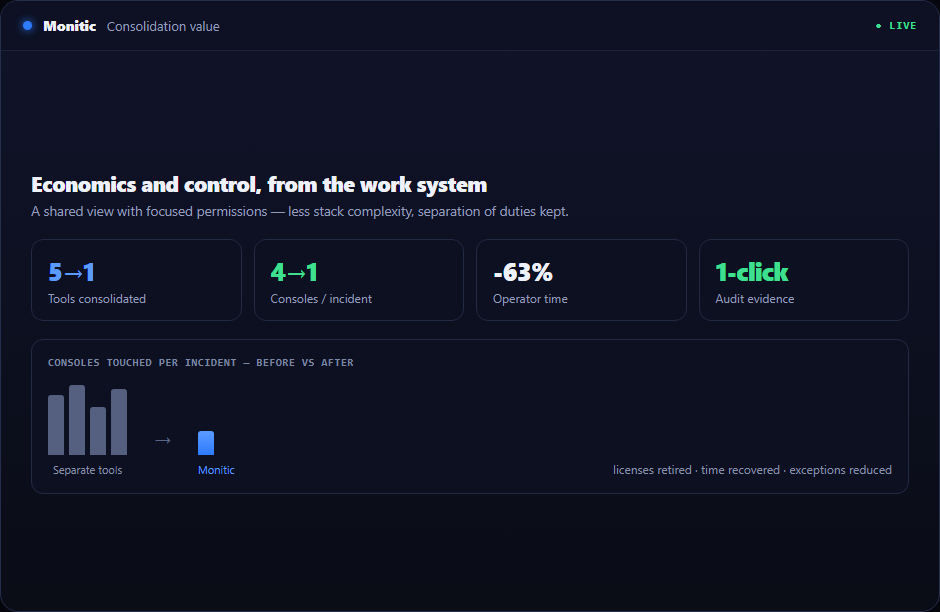
Prometheus Exporter Monitoring creates leverage when it removes coordination as well as manual steps. Technicians spend less time finding the right console, leaders receive fresher evidence, and delegation no longer depends on shared administrator credentials.
Internal teams gain one operating model across business units. MSPs gain the same consistency across customer companies while root ownership and company boundaries prevent the convenience of a shared platform from becoming cross-tenant risk.
Connected to the rest of the platform
Adjacent modules extend the value of prometheus exporter monitoring: inventory identifies the resource, monitoring supplies current state, service workflows coordinate people, and automation executes stable runbooks. Mon-Ai can correlate those records without bypassing the directing user's permissions.
Frequently asked questions
Does consolidation mean every team sees the same information?
No. Teams share the underlying operating record, but company restrictions and role permissions determine which views and actions each person receives.
How is an exception handled?
An exception can remain visible with ownership, route into a ticket or workflow, or be included in reporting until the expected state is restored and verified.
Does the audit trail store sensitive payloads?
Audit records are designed around metadata and stable identifiers. Credentials, decrypted secrets, and other sensitive values should not be placed in audit data.
What is the fastest way to prove value?
Select a costly handoff in the Prometheus Exporter Monitoring workflow, measure its current time and failure points, then repeat the workflow in the 14-day trial using live platform context.
See Monitic on your own fleet
Full-featured 14-day trial · no credit card · your real fleet in the console on day one.