Endpoint monitoring software built on live data
When an executive asks "are we healthy right now?", the honest answer from most endpoint monitoring software is "we were, five minutes ago." Monitic monitors the fleet in real time: CPU, memory, disk, and temperature telemetry streams from every Windows, Linux, and macOS endpoint into dashboards that update over WebSocket the instant the device does. And because Monitic is built to act, monitoring is the start of a fix — not the end of a report.
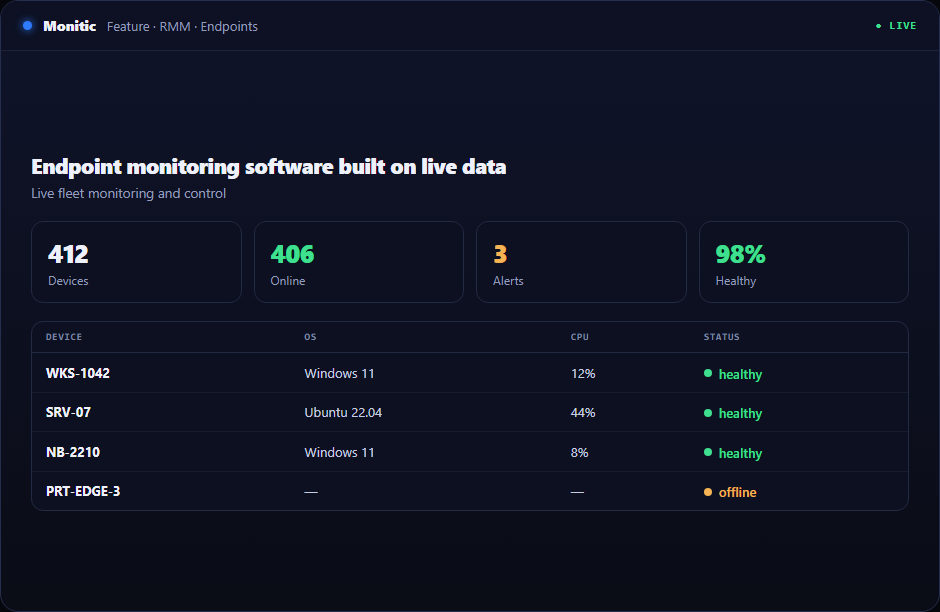
Real-time performance metrics on every endpoint
The Monitic agent collects through 50+ data-collection modules, giving each endpoint a continuously updated operational profile:
- CPU, memory, disk, and temperature tracked in real time — the four signals behind most performance incidents
- Hardware and software inventory with checksum-based change detection, so a new disk, a removed application, or a modified service is captured the moment it changes
- One agent and one data model across Windows, Linux, and macOS, so visibility never fragments by operating system
Thresholds on these metrics feed alerting with duration-based hysteresis, which means the alarms that reach a human are the ones that deserve one.
Live dashboards, no refresh button
Updates are pushed to the console over WebSocket. When a disk fills, a temperature climbs, or a process dies, the dashboard reflects it immediately — no polling interval, no stale averages, no "check again in five minutes." For a NOC wall or an on-call engineer, the difference between live and nearly-live is the difference between catching an incident early and reading about it afterward.
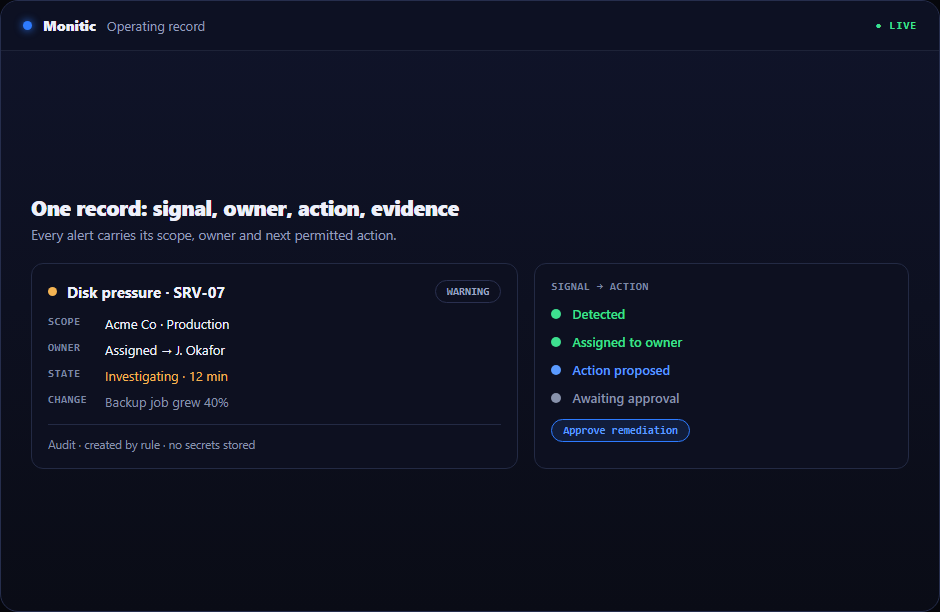
Deeper than metrics: event logs, services, and processes
Numbers tell you something is wrong; context tells you what. Monitic streams Windows Event Logs live into the console, exposes Windows service states with full management control, and lets you attach process watchers to the applications your business depends on. A watcher can alert when a critical process dies — or simply restart it and record that it did, closing the incident before anyone files a ticket.
Monitoring that ends in action
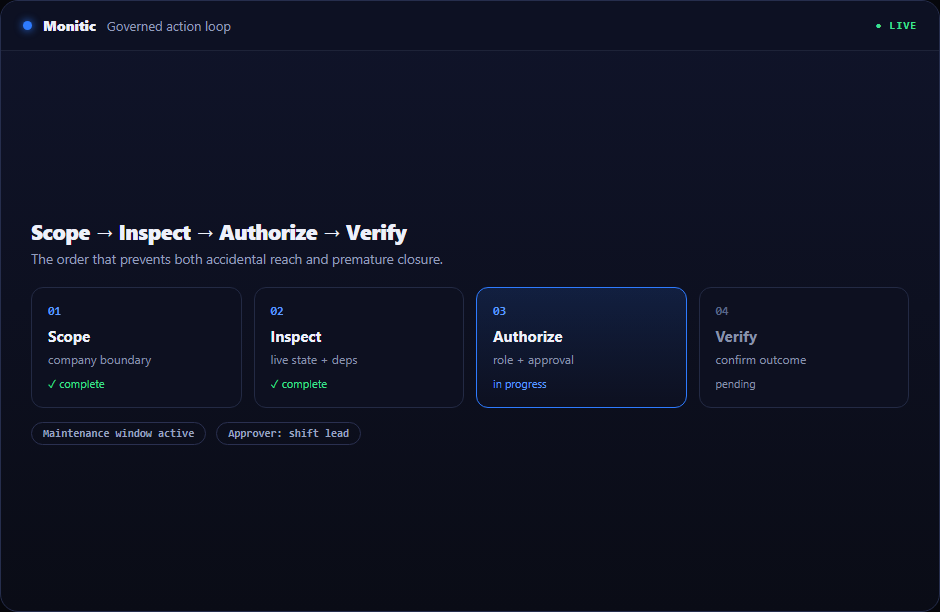
This is where Monitic separates from passive endpoint monitoring software. From the same monitoring view, your team can restart a failed service, shut down or restart a machine, wake it for maintenance, or hand a recurring condition to the automation engine so it never needs a human again. Detection and correction live in one console, on one agent — which is why problems close in hours, not weeks.
Works with
- Alerting — duration-based thresholds on every monitored metric
- The Monitic agent — the lightweight, self-healing collector behind every data point
- Asset inventory — the same telemetry keeps your ITAM record current automatically
Frequently asked questions
Which metrics can Monitic monitor in real time?
CPU, memory, disk, and temperature are streamed live on every endpoint, alongside Windows service states, live Windows Event Logs, process health, and full hardware and software inventory with change detection.
Does real-time monitoring require a heavy agent?
No. One lightweight agent covers monitoring, inventory, patching, and remediation, and its supervisor verifies binary integrity and restarts the agent automatically if it ever fails — see the Monitic agent.
Can monitoring trigger automatic fixes?
Yes. Process watchers can auto-restart critical processes, and alert conditions can drive scripts and tasks through the automation engine. Monitic acts on what it sees rather than waiting for a human to notice.
See Monitic on your own fleet
Full-featured 14-day trial · no credit card · your real fleet in the console on day one.