Monitic + OPNsense
OPNsense is a favorite of teams who like open-source firewalls they can actually reason about — but reasoning about them still means logging into the web UI and reading logs by hand. The Monitic OPNsense integration connects to the firewall over its API and pulls what you actually reach for during an incident into your IT management console: device health, DHCP scope and lease visibility, and a filter-log based policy lookup that tells you why traffic was blocked or allowed.
That last capability matters most in practice. When a user reports "the app doesn't connect," someone eventually has to answer whether the firewall dropped the traffic. With Monitic, you ask that question directly and get an evidence-backed answer from the OPNsense filter log — without leaving the console where the ticket, the endpoint, and the user already live.
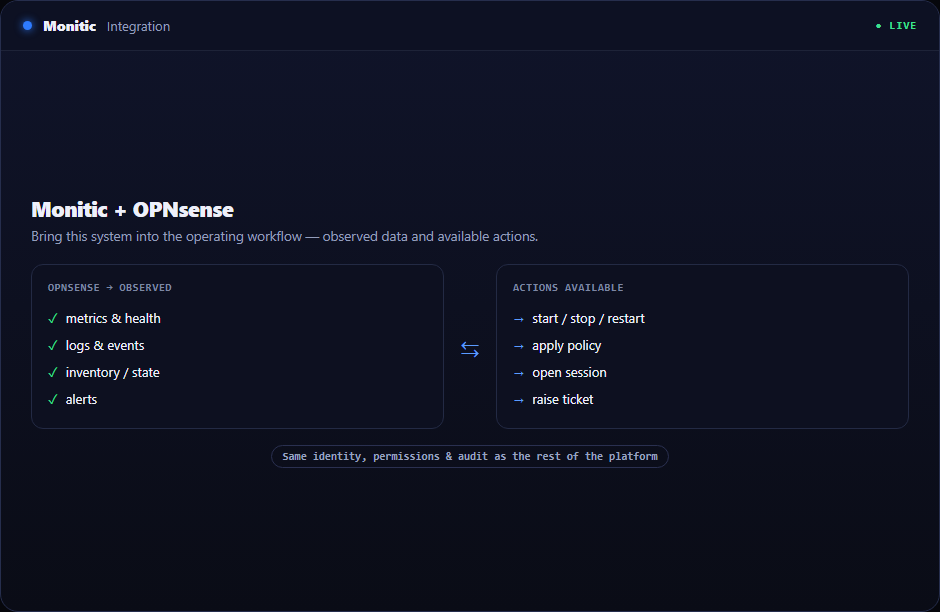
What syncs
| Data | What you get in Monitic |
|---|---|
| Device health | The OPNsense box monitored alongside your servers and endpoints, so firewall trouble shows up in the same alerting surface |
| DHCP scopes | Which address pools exist on the firewall and how they are laid out |
| DHCP leases | Which client holds which address — the raw material for tracing an IP back to a device and a user |
| Filter-log data | The evidence base for policy lookup: what the firewall actually did with traffic |
What you can do
| Action | What it does |
|---|---|
| Policy lookup | Ask whether specific traffic was blocked or allowed; Monitic answers from the OPNsense filter log, so the verdict reflects what really happened rather than what the rulebase implies |
| Trace an address | Pair DHCP lease data with Monitic's endpoint inventory to move from an IP in a log line to a named machine |
| Monitor health | Keep the firewall inside the same health monitoring you run for the rest of the fleet |
Setup summary
The integration is API-based — nothing is installed on the OPNsense host.
- Generate API credentials on your OPNsense firewall.
- Add the device in Monitic's integrations screen with its address and the credentials.
- Monitic connects and begins collecting device health and DHCP data; policy lookup becomes available on demand.
A few minutes of setup, and the firewall is a first-class citizen of your management console.
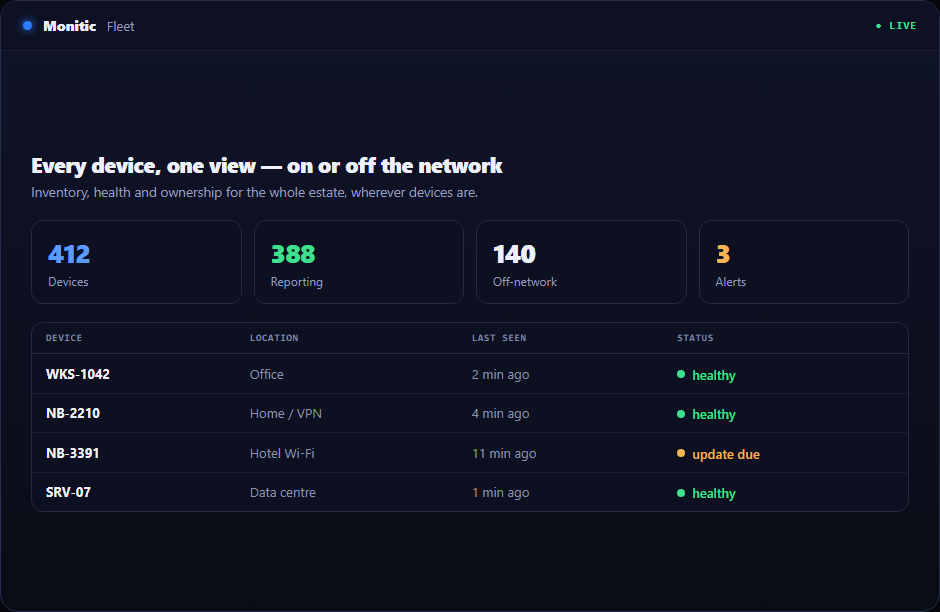
Works with the rest of your stack
OPNsense data lands in Monitic's firewall management module next to whatever else guards your perimeter. Mixed environments are the norm, not the exception — Monitic also integrates with FortiGate and SonicWall, so multi-vendor estates get one consistent view. The full list is on the integrations hub.
Give your OPNsense a seat in the main console
Connect an OPNsense firewall during the 14-day trial and run a policy lookup on the next connectivity ticket that lands. The time saved is the pitch.
Frequently asked questions
How does the OPNsense policy lookup differ from reading rules?
It works from the filter log — the record of what the firewall actually did — rather than from a static reading of the rulebase. That means the verdict you get reflects real firewall behavior for real traffic.
Does anything get installed on the firewall?
No. Monitic talks to OPNsense over its API using credentials you create. The firewall keeps running exactly as before.
Can Monitic modify OPNsense rules?
The integration focuses on visibility and diagnosis: device health, DHCP scopes and leases, and policy lookup. Rule editing remains in your existing OPNsense workflow.
We run OPNsense at several sites — does that work?
Yes. Each firewall you connect appears in the same firewall management view, so distributed deployments are monitored side by side rather than one browser tab per site.
See Monitic on your own fleet
Full-featured 14-day trial · no credit card · your real fleet in the console on day one.